Choose a PPI network
Select the protein-protein interaction source you want to use, such as HPRD, DiamondNet, HINT, or BioGRID.
Tip: Results can differ by network because each source contains different interaction evidence.
User guide
Explore relationships among diseases, drugs, groups of proteins, in the protein-protein interaction network.
Workflow
Most analyses follow the same pattern: choose a network, select/build one or more groups, then visualize and interpret the results.
Select the protein-protein interaction source you want to use, such as HPRD, DiamondNet, HINT, or BioGRID.
Tip: Results can differ by network because each source contains different interaction evidence.
Search for diseases, drugs, or proteins. Verdict converts each selection into a protein group.
Example: Add a disease group, then add a drug group to compare them in the interactome.
Once your groups are added, click on Visualize to create the network. Use the side panels to inspect proteins, metrics, context, pathways, and enrichment results.
Searching
Use the tabs on the search page to decide what type of biological entity you want to add.
Start typing a disease name and choose a match from the autocomplete list. Verdict adds known disease proteins and the selected number of predicted proteins.
Example: Search for "breast cancer" and request 5 predictions.
Search for a drug to add its known targets and predicted targets. This is useful for comparing drug action with a disease module or custom protein set.
Example: Search for "canakinumab" and compare it with a disease group.
Use the Proteins tab to create a custom group from genes or proteins of interest. You can type multiple proteins or upload a text file with a list of proteins (one per line and represented by its gene symbol).
Example: Create a group named "Inflammation markers" with IL1B, IL6, and TNF.
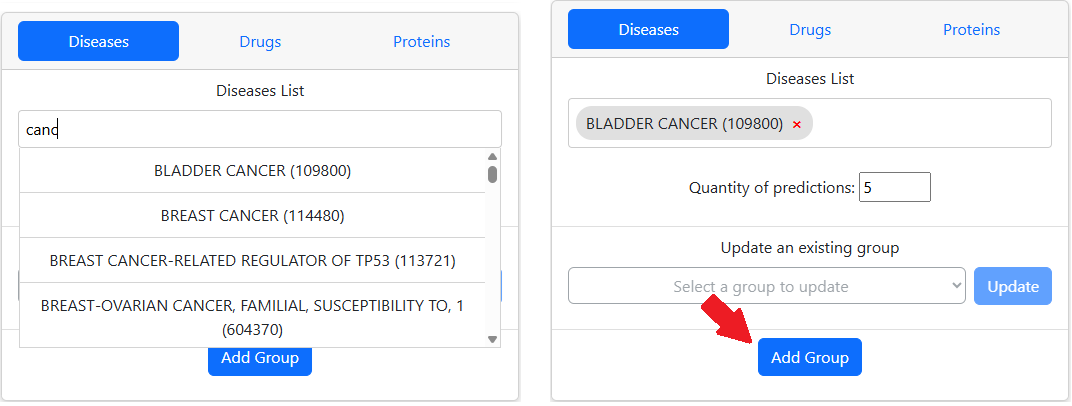
Inputs
A group can come from a disease, drug, or custom protein list.
Adds the selected disease, drug, or protein set to the table. The table shows the group name, color, protein list, controls for including or removing proteins and a delete button for each group.
Use this when you want to add more proteins to a group you already created instead of starting a new group.
Each group receives a color at random or it can be manually pick by clicking the color picker on the group table. Known or seed proteins use the stronger group color, while predictions use a lighter paired color.
Each prediction can be clicked for removing or bringing them back in the table section. Use this to test whether the network interpretation changes when predictions are included.
Visualization
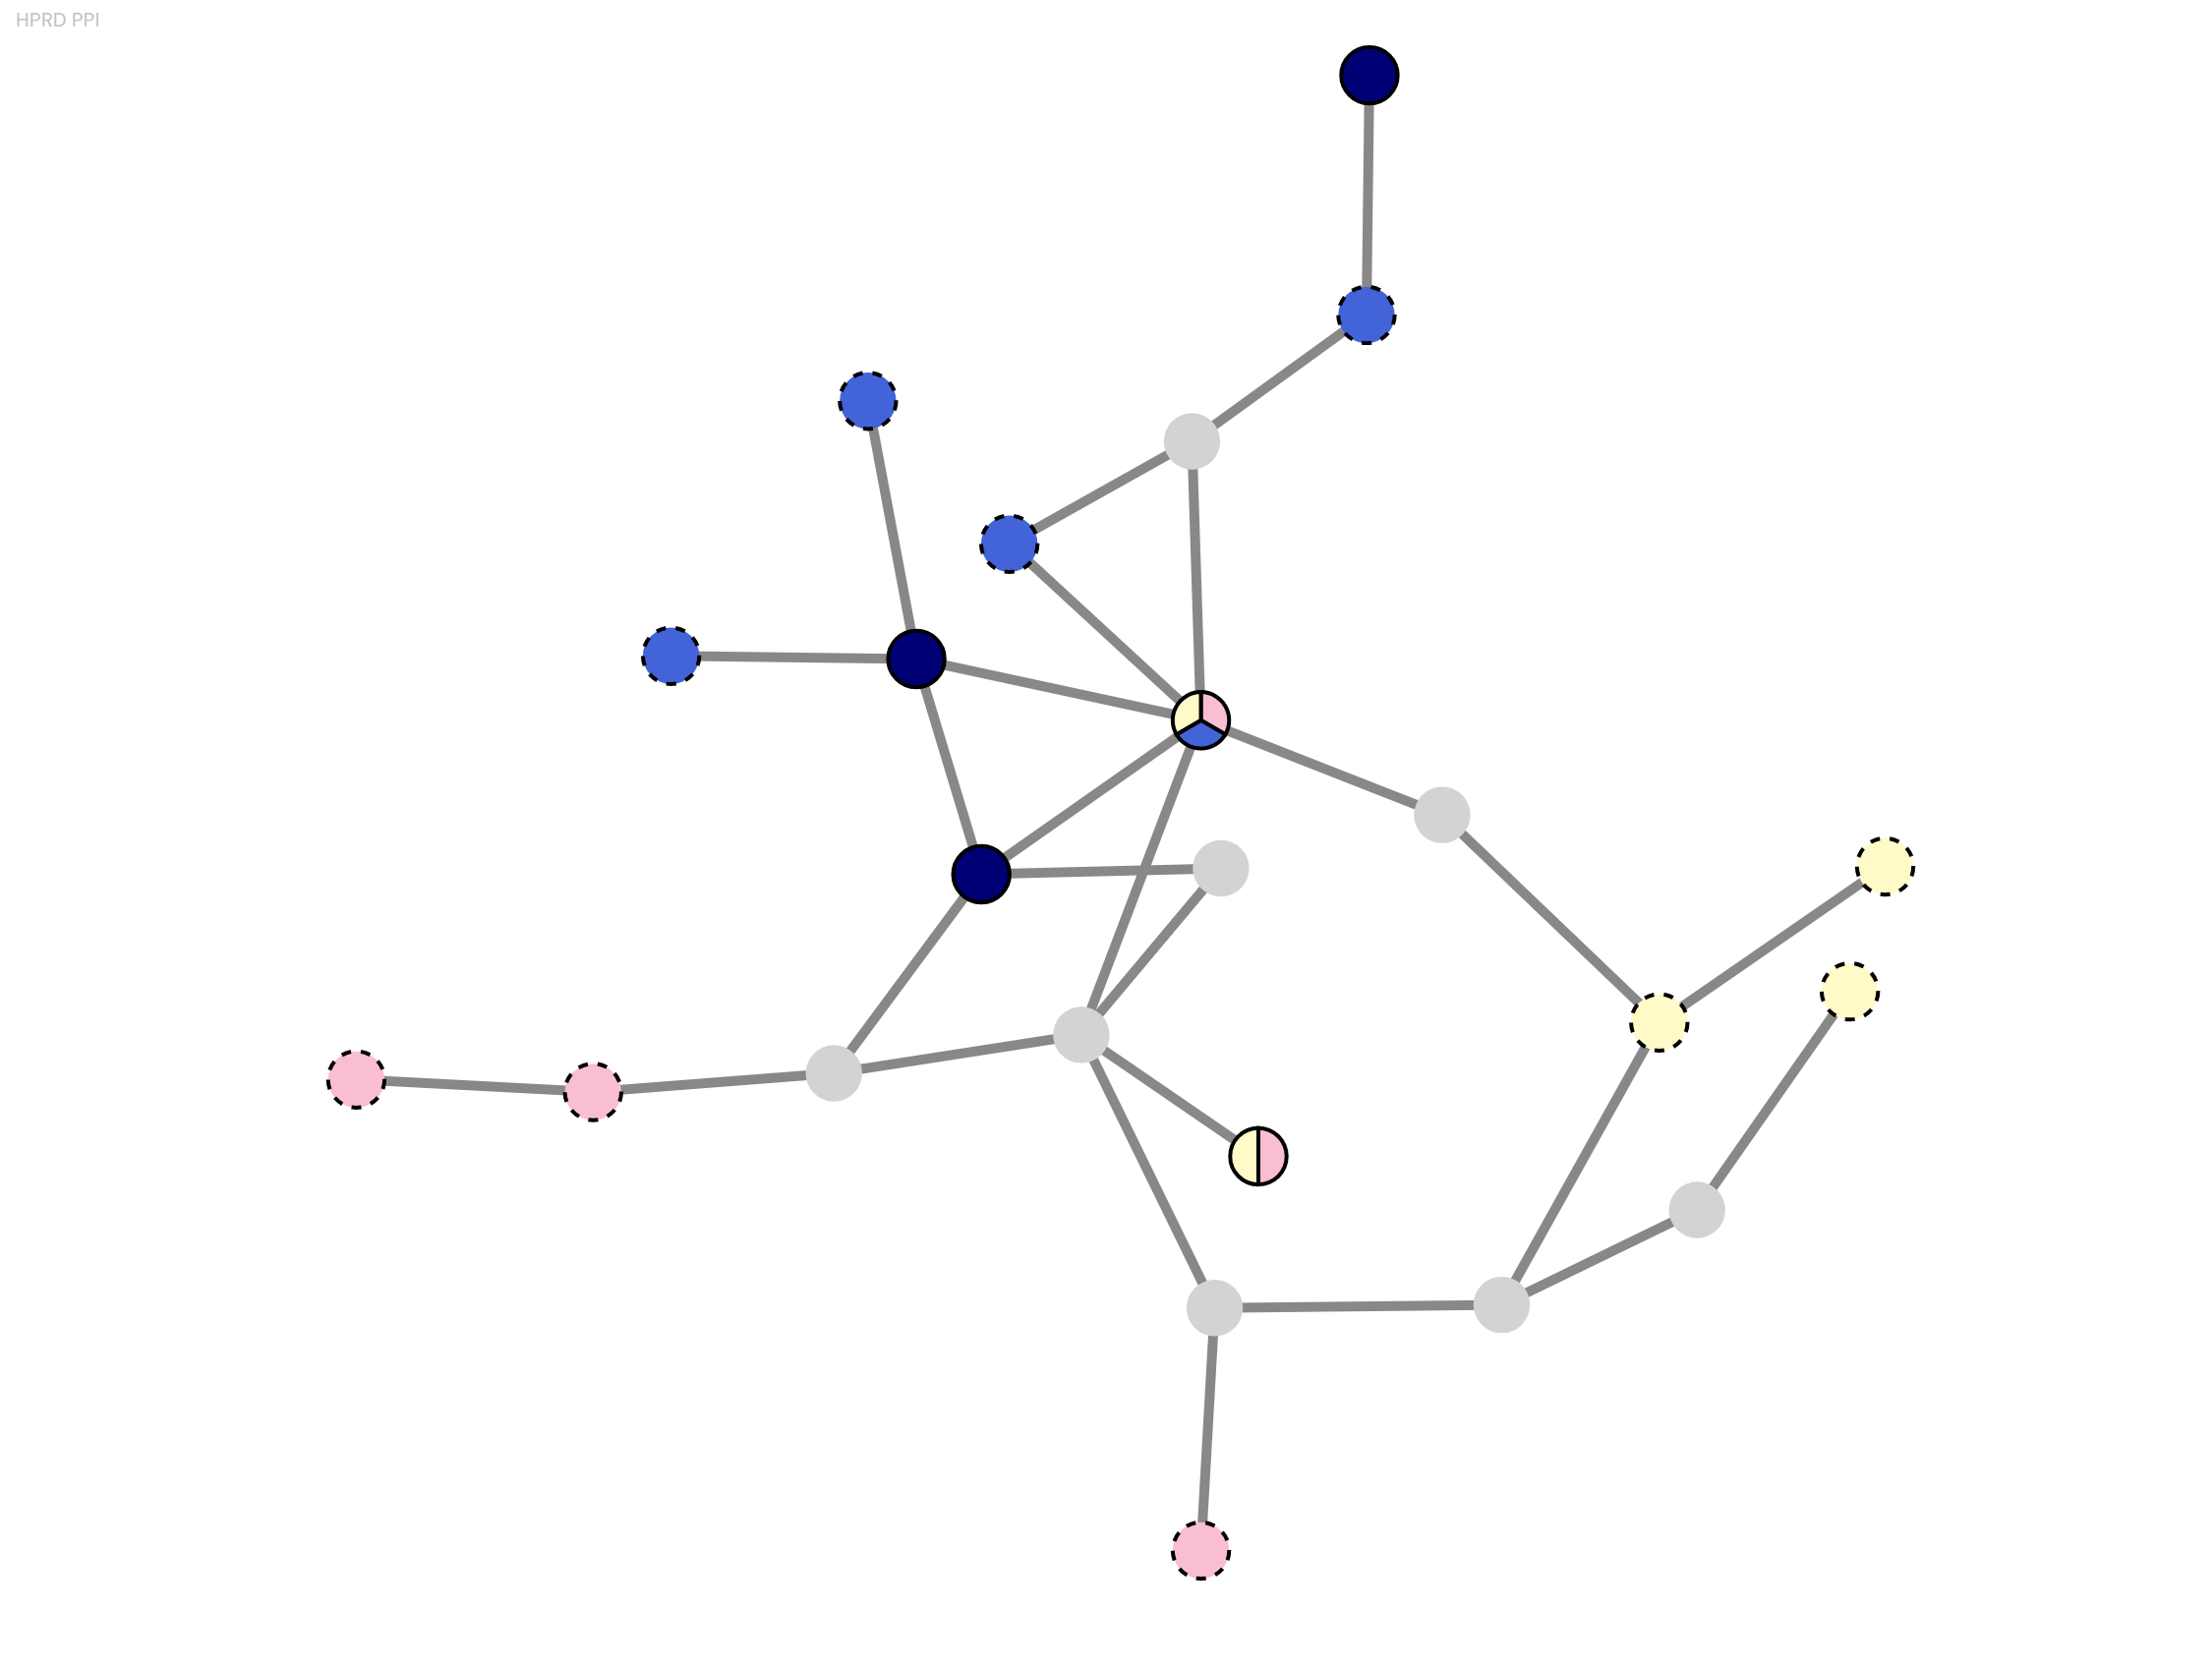
The network view shows proteins as nodes and interactions as links. Side panels list group members, network context, metrics, pathways, and enrichment results.
Screenshot placeholder
Annotated network
Label seed, predicted, shared, and context/intermediate proteins.
Hover over proteins in the graph or list to highlight the matching node. Click a protein name to open external information such as UniProt or NCBI Gene when available.
The left panel helps inspect group members and enrichment. The right panel summarizes metrics between groups.
Interpretation
Verdict combines network scores, percentile summaries, pathway membership, and overrepresentation analysis (ORA) to help you reason about biological relationships.
Prediction scores rank candidate proteins/targets for the selected disease or drug. Higher-ranked proteins are stronger candidates within that search and selected PPI network.
Tip: Compare scores within the same network and input type. Scores from different PPI networks may not be directly interchangeable.
Percentiles show where a score or metric sits relative to a background distribution. For example, P90 means the value is around the 90th percentile of its reference set.
Metrics such as Commute Time, Diffusion, pStep2, pStep4, and pStep6 summarize network proximity or connectivity patterns within and between groups.
Overrepresentation analysis asks whether proteins in a group are enriched for known biological categories, such as Gene Ontology terms.
Bars usually represent -log(adjusted p-value), so longer bars indicate smaller adjusted p-values.
Controls
Use the controls to make the network easier to inspect, compare, and present.
Change the graph layout from the top navigation in the visualization view. D3 force is useful for organic network structure; grid and circle layouts can help compare many nodes.
Use Explore when you want to interact with the network more freely, inspect nodes, and follow connections.
Turn labels on when preparing figures or checking exact gene symbols.
Context settings control how many intermediate proteins are shown. More context can reveal bridges; less context keeps the display focused on your selected groups.
Use group colors to keep related proteins visually linked. Choose distinct colors when comparing several diseases or drugs.
Use prediction toggles and group controls to ask "does this conclusion depend on predicted proteins, or is it visible using seeds only?"
Export
Downloads let you keep a record of your analysis.
Download the current graph view as an image.
Use this when you need the underlying nodes, links, group assignments, metrics, and related result tables for further analysis.
FAQ
No. Predicted proteins are computational candidates. They are useful for hypothesis generation and prioritization, but they require biological interpretation and validation.
Each PPI network contains different interaction data and coverage. A protein may be highly connected in one network and absent or less connected in another.
Start small, such as 5 to 10 predictions, then increase if you need broader coverage. Smaller networks are easier to interpret visually.
Use them as clues about possible connecting mechanisms. A context protein is not necessarily part of the original disease or drug set, but it may explain how selected proteins are linked.
A shared protein appears in more than one group. It may indicate overlap between disease mechanisms, drug targets, predictions, or custom input sets.
ORA may be unavailable if too few proteins pass the required thresholds or if no terms are significantly enriched for the current group.
Use the exported tables and network data to document the exact inputs, PPI network, prediction quantity, and interpretation steps. Add methodological details and validation as required for your study.