 Department of Computer Science


Improving GO semantic similarity measures using downward random walks
Haixuan Yang, Tamás Nepusz, Alberto Paccanaro
Bioinformatics, vol. 28, iss. 10, p. 1383-1389, 2012. 
This page contains a short informal description of the main concepts described in the above paper. Also, the MATLAB code for all the algorithms described in the paper can be downloaded from here. If you use the code for your research, please cite the paper.
Several measures have been recently proposed for quantifying the functional similarity between gene products according to well-structured controlled vocabularies where biological terms are organized in a tree or in a directed acyclic graph (DAG) structure. However, existing semantic similarity measures ignore two important facts. First, when calculating the similarity between two terms, they disregard the descendants of these terms. While this makes no difference when the ontology is a tree, we shall show that it has important consequences when the ontology is a DAG -- this is the case, with the Gene Ontology (GO). For example, see Figure 1, the similarity between M and N should be larger than the similarity between I and L. Second, existing similarity measures do not model the inherent uncertainty which comes from the fact that our current knowledge of the gene annotation and of the gene ontology structure is incomplete. Here we propose a novel approach based on downward random walks that can be used to improve any of the existing similarity measures to exhibit these two properties.
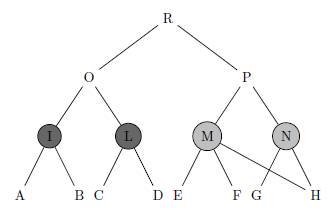
Figure 1: This is a small example where we coloured two pairs of terms (I, L) and (M, N ) for which the ontology structure is identical above them, but different below. In fact the children of term I and term L are completely disjoint, while terms M and N have a common child. Without loss of generality, we can assume that the sets of genes annotated to the leaves A, B, C, D, E, F, G, H are disjoint and that the set of genes assigned to I, L, M, N but not to their children are also disjoint. Due to the ontology structure, gene products annotated to H are also annotated to both M and N . Therefore, nodes M and N are more similar than nodes I and L because they share more gene products. Ideally, the semantic similarity between M and N should be higher than that between I and L.
We show that our approach greatly improves three commonly used semantic similarity measures which are based on the work of Resnik, Lin and Jiang. We applied these improved measures to the Gene Ontology annotations of the yeast Saccharomyces cerevisiae, and tested how they correlate with sequence similarity, mRNA co-expression and protein-protein interaction data. Our results consistently show that the use of downward random walks leads to more reliable similarity measures. See Figure 2-4.
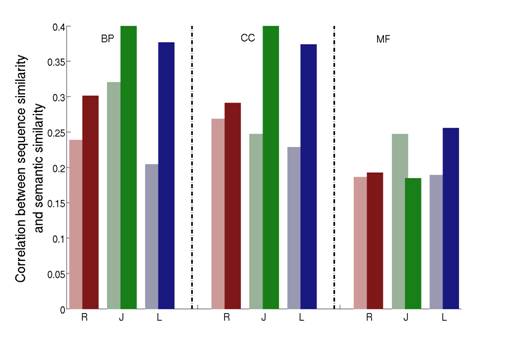
Figure 2: Correlations between sequence similarity and semantic similarities in Yeast, shown separately for the three DAGs of the Gene Ontology (BP=Biological Process; CC=Cellular Component; MF=Molecular Function). For a given HSM (R=Resnik; J=Jiang; L=Lin) the lighter color shade represents the original HSM while the darker color shade the corresponding ISM.
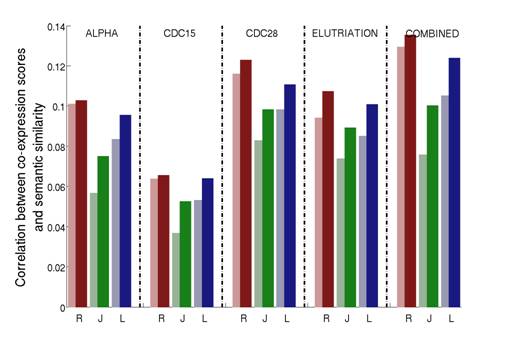
Figure 3: Correlations between the gene co-expression scores and the semantic similarity on the biological process (BP) aspect. Measures are calculated for the four individual cell cycle dataset for the yeast Saccharomyces cerevisiae (α factor, CDC15, CDC28 and elutriation) as well as the combined dataset, which is obtained by concatenating the four individual arrays. For a given HSM (R=Resnik; J=Jiang; L=Lin) the lighter color shade represents the original HSM while the darker color shade the corresponding ISM.
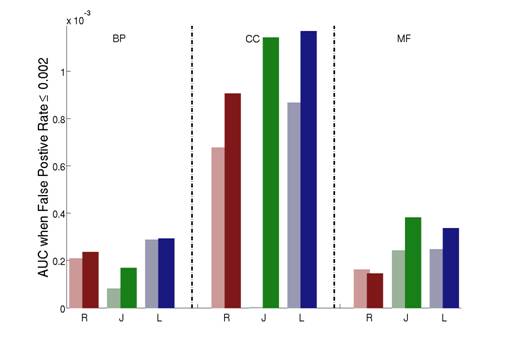
Figure 4: The AUC (area under the ROC curve) scores comparing the different semantic similarity measures on each of the three aspects of the Gene Ontology for protein-protein interactions. R: Resnik; J: Jiang; L: Lin. Light color: host measure; Dark color: improved measure. Note that we use the part of the ROC curves where the false positive rate is less than or equal to 0.002.
The MATLAB code for all the algorithms described in the paper can be downloaded from here. If you use the code for your research, please cite the paper.
![]() We have just released GOSSTO, a web server for computing semantic similarities with this measure. You can try it at paccanarolab.org/gosstoweb.
We have just released GOSSTO, a web server for computing semantic similarities with this measure. You can try it at paccanarolab.org/gosstoweb.