ClusterONE Web Documentation
1. Introduction
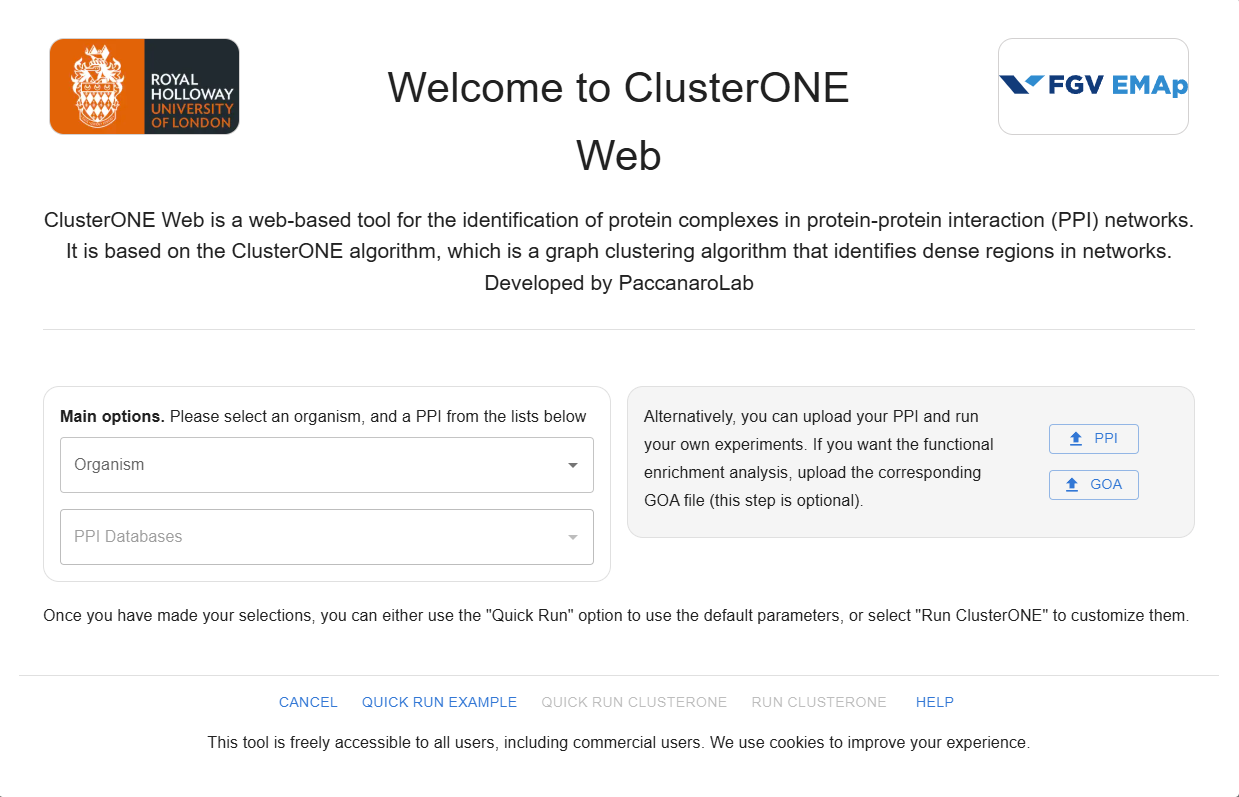
ClusterONE Web is a freely available, web-based tool for identifying and analyzing protein complexes from protein-protein interaction (PPI) networks. The tool provides an interactive interface for running ClusterONE on preloaded datasets or user-uploaded networks, along with built-in Gene Ontology (GO) enrichment analysis.
Access the web server at: https://paccanarolab.org/clusteroneweb/
2. Getting Started
To use ClusterONE Web:
- Open the web server in a compatible browser (Chrome, Firefox, Edge).
- Select a dataset from the preloaded database or upload your own.
- Use the Quick Example button to load an example dataset instantly.
- Adjust parameters as needed or use the Quick Run button to execute ClusterONE with default settings.
- Explore detected complexes and enrichment results.
3. Input Data
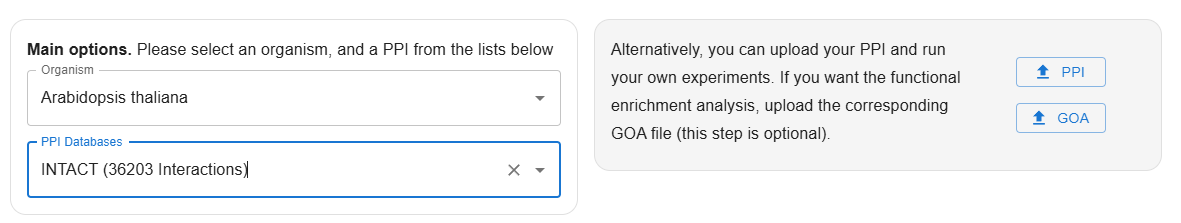
ClusterONE Web provides access to a database of PPI datasets from sources such as BioGRID, IntAct, MINT, and DIP, spanning multiple organisms.
Users must first select an organism from the dropdown list; they can either type to search or directly choose from the options by scrolling down.
Users can also upload their own PPI networks in TXT or CSV format, and optionally provide Gene Ontology annotation files for enrichment analysis. These files should follow a specific format, where each line consists of “id1 id2 weight”, with id1 and id2 representing the interacting proteins and weight indicating the confidence value between 0 and 1. The identifiers (id1 and id2) may be user-defined and do not need to correspond to known database identifiers such as UniProt IDs. If the weight is omitted, it is assumed to be 1, which applies to unweighted PPI networks. The columns of the input file may be separated by commas, spaces, or tabs; however, these separator characters should not be mixed within the same file.
Database version information: GOA files 2025-03-08, BioGRID version 4.4.237, and IntAct, MINT, and DIP were downloaded in September 2024.
3.1 Input Data Statistics
| Organism | BIOGRID | DIP | INTACT | MINT |
|---|---|---|---|---|
| Acinetobacter baumannii (strain AB0057) | N/A | N/A | Proteins: 48, Interactions: 74 | N/A |
| Arabidopsis thaliana | Proteins: 10200, Interactions: 52530 | Proteins: 323, Interactions: 405 | Proteins: 7609, Interactions: 36203 | Proteins: 329, Interactions: 420 |
| Bacillus subtilis (strain 168) | N/A | N/A | Proteins: 674, Interactions: 1573 | Proteins: 237, Interactions: 255 |
| Bos taurus | Proteins: 173, Interactions: 165 | N/A | Proteins: 350, Interactions: 600 | Proteins: 79, Interactions: 90 |
| Caenorhabditis elegans | Proteins: 5703, Interactions: 15996 | Proteins: 99, Interactions: 89 | Proteins: 4908, Interactions: 14026 | Proteins: 447, Interactions: 461 |
| Campylobacter jejuni subsp. jejuni serotype O:2 (strain ATCC 700819 / NCTC 11168) | N/A | N/A | Proteins: 1293, Interactions: 11298 | N/A |
| Candida albicans (strain SC5314 / ATCC MYA-2876) | Proteins: 273, Interactions: 359 | N/A | N/A | N/A |
| Chaetomium thermophilum (strain DSM 1495 / CBS 144.50 / IMI 039719) | N/A | Proteins: 46, Interactions: 54 | Proteins: 113, Interactions: 252 | N/A |
| Chlamydomonas reinhardtii | N/A | N/A | Proteins: 69, Interactions: 144 | N/A |
| Danio rerio | Proteins: 389, Interactions: 405 | N/A | Proteins: 228, Interactions: 315 | Proteins: 112, Interactions: 120 |
| Dictyostelium discoideum | Proteins: 55, Interactions: 56 | N/A | Proteins: 130, Interactions: 164 | N/A |
| Drosophila melanogaster | Proteins: 8873, Interactions: 52261 | Proteins: 287, Interactions: 262 | Proteins: 11320, Interactions: 58090 | Proteins: 327, Interactions: 402 |
| Emericella nidulans (strain FGSC A4 / ATCC 38163 / CBS 112.46 / NRRL 194 / M139) | Proteins: 49, Interactions: 55 | N/A | N/A | N/A |
| Enterococcus faecalis | N/A | N/A | Proteins: 51, Interactions: 99 | N/A |
| Escherichia coli | N/A | N/A | Proteins: 64, Interactions: 105 | N/A |
| Escherichia coli (strain K12) | Proteins: 324, Interactions: 340 | Proteins: 999, Interactions: 1314 | Proteins: 3220, Interactions: 24440 | Proteins: 178, Interactions: 219 |
| Gallus gallus | Proteins: 256, Interactions: 293 | N/A | Proteins: 211, Interactions: 264 | N/A |
| Gerbera hybrida | N/A | N/A | Proteins: 14, Interactions: 103 | N/A |
| Haloarcula marismortui (strain ATCC 43049 / DSM 3752 / JCM 8966 / VKM B-1809) | N/A | N/A | Proteins: 31, Interactions: 56 | N/A |
| Haloferax volcanii (strain ATCC 29605 / DSM 3757 / JCM 8879 / NBRC 14742 / NCIMB 2012 / VKM B-1768 / DS2) | N/A | N/A | Proteins: 138, Interactions: 695 | N/A |
| Helicobacter pylori (strain ATCC 700392 / 26695) | N/A | N/A | Proteins: 962, Interactions: 2250 | Proteins: 730, Interactions: 1473 |
| Homo sapiens | Proteins: 17623, Interactions: 670113 | Proteins: 2694, Interactions: 3946 | Proteins: 21133, Interactions: 491011 | Proteins: 9393, Interactions: 37620 |
| Mus musculus | Proteins: 8131, Interactions: 30624 | Proteins: 1092, Interactions: 1116 | Proteins: 7485, Interactions: 20815 | Proteins: 3591, Interactions: 5576 |
| Mycobacterium tuberculosis (strain ATCC 25618 / H37Rv) | N/A | N/A | Proteins: 98, Interactions: 148 | N/A |
| Mycolicibacterium smegmatis (strain ATCC 700084 / mc(2)155) | N/A | N/A | Proteins: 64, Interactions: 94 | N/A |
| Mycoplasma pneumoniae (strain ATCC 29342 / M129 / Subtype 1) | N/A | N/A | Proteins: 366, Interactions: 505 | N/A |
| Myxococcus xanthus (strain DK1622) | N/A | N/A | Proteins: 82, Interactions: 366 | N/A |
| Nematostella vectensis | N/A | N/A | Proteins: 29, Interactions: 77 | N/A |
| Nitratidesulfovibrio vulgaris (strain ATCC 29579 / DSM 644 / CCUG 34227 / NCIMB 8303 / VKM B-1760 / Hildenborough) | N/A | N/A | Proteins: 558, Interactions: 644 | N/A |
| Oryctolagus cuniculus | N/A | N/A | Proteins: 165, Interactions: 186 | N/A |
| Oryza sativa subsp. japonica | Proteins: 249, Interactions: 244 | N/A | Proteins: 224, Interactions: 257 | N/A |
| Petunia hybrida | N/A | N/A | Proteins: 23, Interactions: 81 | N/A |
| Pisum sativum | N/A | N/A | Proteins: 52, Interactions: 115 | N/A |
| Plasmodium falciparum (isolate 3D7) | Proteins: 1110, Interactions: 2148 | N/A | Proteins: 1129, Interactions: 2140 | N/A |
| Pseudomonas aeruginosa (strain ATCC 15692 / DSM 22644 / CIP 104116 / JCM 14847 / LMG 12228 / 1C / PRS 101 / PAO1) | N/A | N/A | Proteins: 64, Interactions: 63 | N/A |
| Pyrococcus furiosus (strain ATCC 43587 / DSM 3638 / JCM 8422 / Vc1) | N/A | N/A | Proteins: 84, Interactions: 135 | N/A |
| Rattus norvegicus | Proteins: 2675, Interactions: 5377 | Proteins: 191, Interactions: 167 | Proteins: 2563, Interactions: 4623 | Proteins: 1114, Interactions: 1738 |
| Rhodopseudomonas palustris (strain ATCC BAA-98 / CGA009) | N/A | N/A | Proteins: 53, Interactions: 52 | N/A |
| Rickettsia sibirica (strain ATCC VR-151 / 246) | N/A | N/A | Proteins: 160, Interactions: 282 | N/A |
| Saccharolobus solfataricus (strain ATCC 35092 / DSM 1617 / JCM 11322 / P2) | N/A | N/A | Proteins: 42, Interactions: 61 | N/A |
| Saccharomyces cerevisiae (strain ATCC 204508 / S288c) | Proteins: 5656, Interactions: 132131 | Proteins: 4312, Interactions: 15140 | Proteins: 5863, Interactions: 115242 | Proteins: 4403, Interactions: 18837 |
| Salmonella typhimurium (strain 14028s / SGSC 2262) | N/A | N/A | Proteins: 33, Interactions: 51 | N/A |
| Salmonella typhimurium (strain LT2 / SGSC1412 / ATCC 700720) | N/A | N/A | Proteins: 65, Interactions: 109 | N/A |
| Schizosaccharomyces pombe (strain 972 / ATCC 24843) | Proteins: 3133, Interactions: 11588 | Proteins: 183, Interactions: 265 | Proteins: 949, Interactions: 2195 | Proteins: 198, Interactions: 314 |
| Solanum lycopersicum | Proteins: 36, Interactions: 79 | N/A | N/A | N/A |
| Spinacia oleracea | N/A | N/A | Proteins: 90, Interactions: 85 | N/A |
| Streptococcus pneumoniae serotype 4 (strain ATCC BAA-334 / TIGR4) | N/A | N/A | Proteins: 184, Interactions: 213 | N/A |
| Synechococcus elongatus (strain ATCC 33912 / PCC 7942 / FACHB-805) | N/A | N/A | Proteins: 16, Interactions: 53 | N/A |
| Synechocystis sp. (strain PCC 6803 / Kazusa) | N/A | N/A | Proteins: 1902, Interactions: 3312 | N/A |
| Tetrahymena thermophila (strain SB210) | N/A | N/A | Proteins: 61, Interactions: 95 | N/A |
| Thermococcus kodakarensis (strain ATCC BAA-918 / JCM 12380 / KOD1) | N/A | N/A | Proteins: 125, Interactions: 130 | Proteins: 122, Interactions: 120 |
| Thermosynechococcus vestitus (strain NIES-2133 / IAM M-273 / BP-1) | N/A | N/A | Proteins: 64, Interactions: 93 | N/A |
| Thermus thermophilus (strain ATCC 27634 / DSM 579 / HB8) | N/A | N/A | Proteins: 112, Interactions: 461 | N/A |
| Thermus thermophilus (strain ATCC BAA-163 / DSM 7039 / HB27) | N/A | N/A | Proteins: 59, Interactions: 165 | N/A |
| Treponema pallidum (strain Nichols) | N/A | N/A | Proteins: 711, Interactions: 3533 | N/A |
| Trypanosoma brucei brucei (strain 927/4 GUTat10.1) | N/A | N/A | Proteins: 128, Interactions: 217 | N/A |
| Xenopus laevis | Proteins: 1027, Interactions: 1356 | N/A | Proteins: 237, Interactions: 386 | Proteins: 113, Interactions: 141 |
| Zea mays | N/A | N/A | Proteins: 14800, Interactions: 50340 | N/A |
4. Running ClusterONE
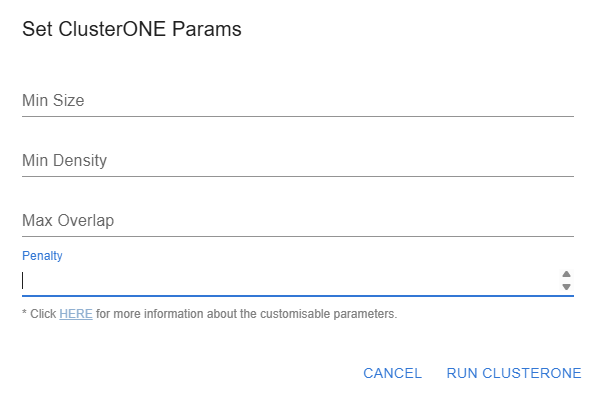
Users can run ClusterONE with the default parameters using the Quick Run button or customize the following settings by clicking on Run ClusterONE:
- Minimum size: The minimum size of clusters deemed relevant by ClusterONE. This is a hard threshold: whenever ClusterONE finds a cluster smaller than the minimum size, the cluster will be discarded immediately.
- Minimum density: The minimum density of clusters deemed relevant by ClusterONE. The density of a cluster is the total sum of edge weights within the cluster, divided by the number of theoretically possible edges within the cluster. In other words, this is the average edge weight within the cluster if missing edges are assumed to have a weight of zero. Whenever ClusterONE finds a cluster that has a smaller density than the value given here, the cluster will be discarded immediately. Increase the minimum density if you get too many clusters and they seem too sparse, or decrease it if you are not getting enough clusters.
- Max overlap: For each pair of clusters found, ClusterONE calculates a score that quantifies the overlap between them, and two clusters are merged if this overlap is larger than a given threshold.
- Penalty: Penalty value corresponding to each node. When you set this option to a specific value x, ClusterONE will assume that each node has an extra boundary weight of x when it considers the addition of the node to a cluster. It can be used to model the possibility of uncharted connections for each node, so nodes with only a single weak connection to a cluster will not be added to the cluster as the penalty value will outweigh the benefits of adding the node. The default penalty value is 2.
Clicking the Quick Example button runs ClusterONE on the Saccharomyces cerevisiae dataset from Collins et al. (Collins et al., Mol. Cell. Prot., 2007), using default parameters. The results showcase the detection and analysis of protein complexes within this well-characterized interactome.
5. Exploring Results
The main results are displayed in a table that includes the following columns:
- Complex ID
- Overlapping complexes
- Size
- Density
- Cohesiveness
- List of proteins in each complex
Users can sort, filter, search by name, and hide columns as needed. A "Filter" button, located at the top left corner of the main results page, allows users to easily customize filters. For example, selecting the column "Proteins," operator "contains," and value "SYP" retrieves complexes containing proteins matching this string. If a complex overlaps with other complexes, the corresponding complex IDs are listed in the 'Overlapping Complexes' column; otherwise, this column is left empty.
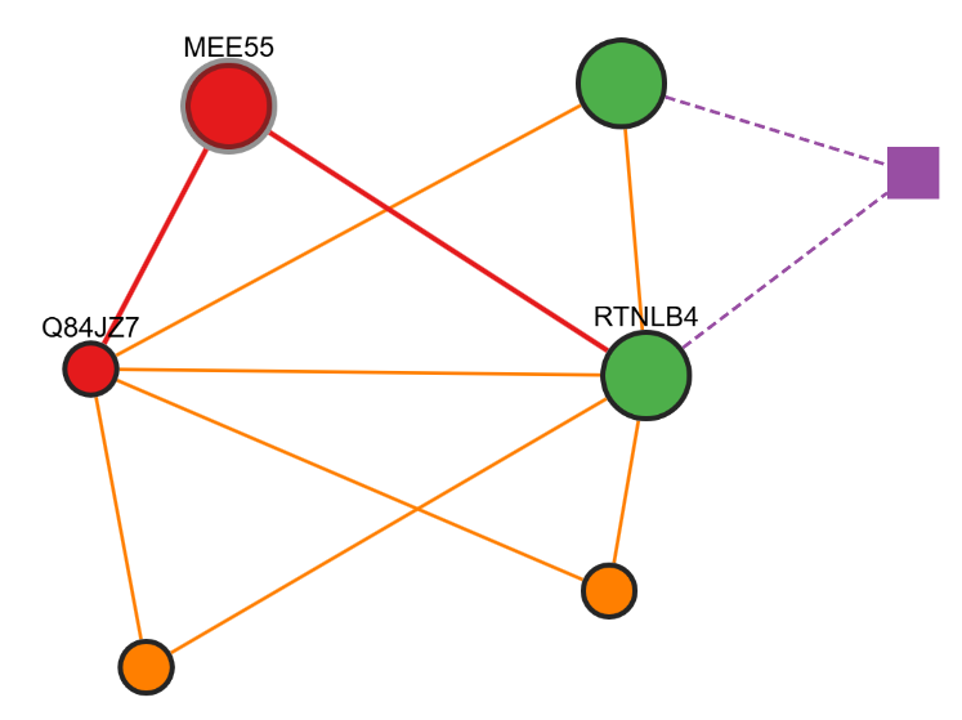
Interactive Graph Features
When you click on a Complex ID, an interactive graph displays the selected complex. Circle nodes represent proteins, while square nodes represent overlapping clusters.
If you select Highlight Overlapping Proteins, those proteins will appear enlarged and in green, making them easier to identify.
Click Actions
- Double-click on a Complex: Opens the corresponding interactive graph.
- Double-click on a Protein: Opens a new tab linking to the corresponding UniProt page.
- Single-click on a Protein: Highlights the protein and its interactions.
- Single-click on the Background: Resets all edges and nodes to their default view.
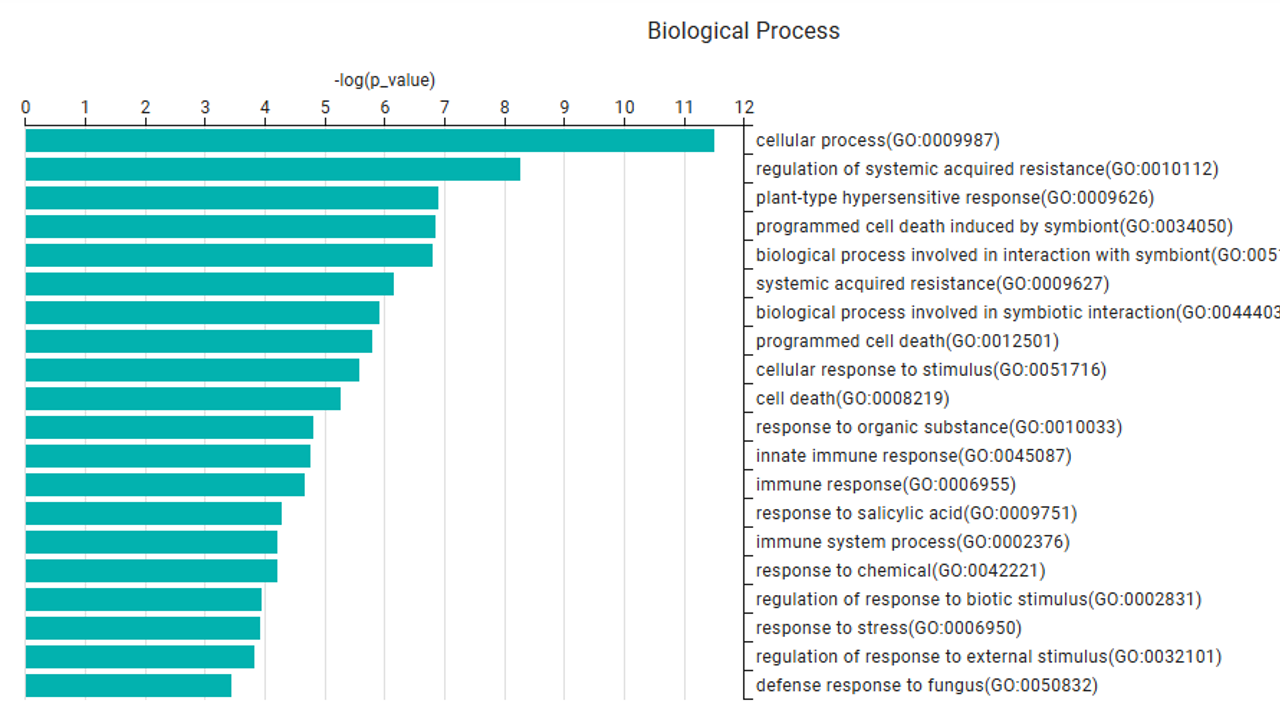
6. Functional Enrichment Analysis
Enrichment analysis identifies overrepresented GO terms in detected complexes, categorized into the three GO domains:
- Biological Process
- Molecular Function
- Cellular Component
After selecting a complex, users can click the Enrichment Analysis button to view its functional enrichment results. The plots show the top 20 over-represented terms for each GO domain.
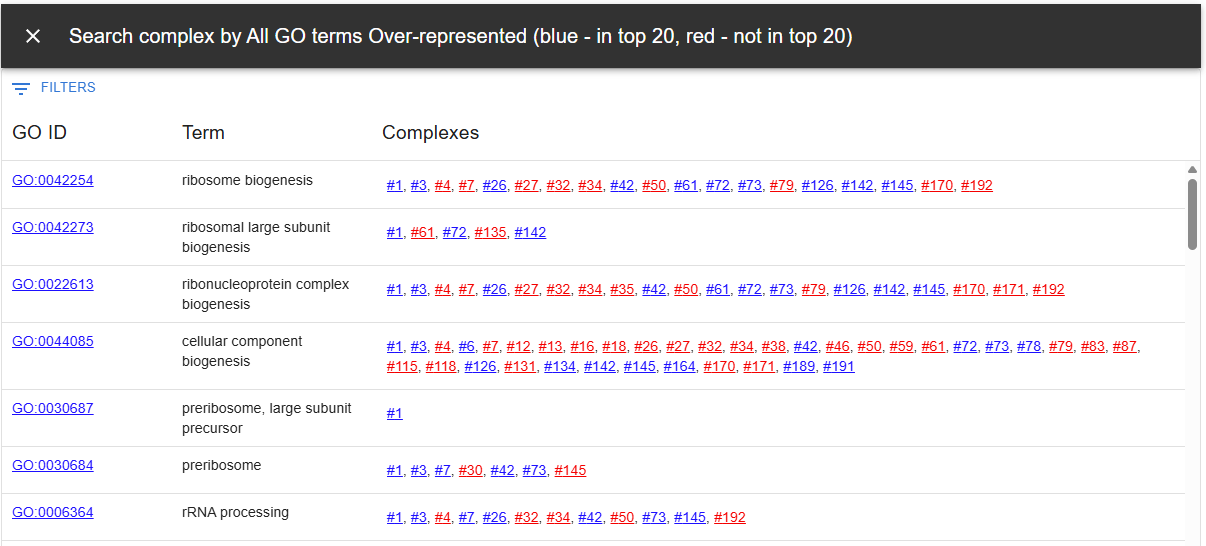
The platform also allows users to search for specific GO terms using the Search by GO term button, enabling functional exploration of the detected complexes. The filter button allows users to filter the table by "Complex ID," "GO ID," or "Term" (GO term name).
7. Exporting & Downloading Results
ClusterONE Web allows users to download various result types available on the platform, including:
- ClusterONE results: Downloadable in CSV format for further analysis. Download button is located in the main results table.
- Publication-quality images: High-resolution visuals for each detected complex. Download button is located at the bottom right corner of the interactive graph visualization page as a camera icon.
- Enrichment analysis reports: Comprehensive reports available in PDF format. Download button is located in the Enrichment Analysis page for each complex.
These features make it easy to integrate ClusterONE Web outputs into your research workflow.
8. FAQ / Troubleshooting
1. What is ClusterONE Web?
ClusterONE Web is an online tool for identifying and analyzing protein complexes from protein-protein interaction (PPI) networks.
2. Do I need to install anything to use ClusterONE Web?
No, ClusterONE Web is entirely browser-based and does not require installation.
3. Which web browsers are supported?
The tool is optimized for Chrome, Firefox, and Edge. Some older browsers may not be fully supported.
4. Can I upload my own PPI dataset?
Yes, users can upload their own PPI network files and, optionally, Gene Ontology (GO) annotation files for enrichment analysis.
5. What file formats are supported for input data?
ClusterONE Web accepts TXT and CSV files for custom PPI networks. These files should follow a specific format, where each line consists of “id1 id2 weight”, with id1 and id2 representing the interacting proteins and weight indicating the confidence value between 0 and 1. The identifiers (id1 and id2) may be user-defined and do not need to correspond to known database identifiers such as UniProt IDs. If the weight is omitted, it is assumed to be 1, which applies to unweighted PPI networks. The columns of the input file may be separated by commas, spaces, or tabs; however, these separator characters should not be mixed within the same file.
6. Are there any limits on dataset size?
No, there is no strict limit on dataset size. However, larger networks take longer to process.
7. What happens if I upload my own PPI network?
The tool will process the network and detect protein complexes using ClusterONE.
Note: If you want enrichment analysis to be available, you must also upload the corresponding Gene Ontology Annotation File (GAF). Without a GAF file, functional enrichment results will not be generated.
8. What do the different ClusterONE parameters mean?
- Minimum size: The smallest allowed protein complex.
- Minimum density: How tightly connected proteins must be to be considered a complex.
- Max overlap: Controls how much overlap is allowed between complexes.
- Penalty: Adjusts how easily new proteins are added to a cluster.
9. Can I adjust parameters manually?
Yes, advanced users can modify clustering parameters before running the analysis by clicking on Run ClusterONE.
10. What happens if I don’t adjust any settings?
The tool will use default parameters, optimized for general PPI network analysis.
11. How are protein complexes displayed?
The results are shown in a table, and clicking on a complex opens an interactive visualization.
12. What does the ‘cohesiveness’ value mean?
Cohesiveness measures how well a complex is internally connected relative to its external connections.
A higher value indicates a tightly connected, well-defined protein complex. The cohesiveness score is used to evaluate cluster quality, ensuring that detected complexes are biologically meaningful.
13. What is enrichment analysis, and why is it useful?
Enrichment analysis helps interpret the biological significance of detected protein complexes by identifying overrepresented Gene Ontology (GO) terms.
- Intuition: A protein complex often performs a specific function within a cell. If many proteins in a complex share a biological role, that function is likely relevant to the complex as a whole. Enrichment analysis systematically tests for such patterns.
- What it provides: It categorizes significant terms into three GO domains:
- Biological Process (BP) – what the complex does (e.g., “DNA repair,” “signal transduction”).
- Molecular Function (MF) – the activities of individual proteins (e.g., “ATP binding,” “kinase activity”).
- Cellular Component (CC) – where the complex is located (e.g., “nucleus,” “mitochondrion”).
- How it works: ClusterONE Web compares the frequency of GO terms in a complex to their frequency in all annotated proteins of the same organism. If a term is significantly enriched, it suggests that the complex is functionally specialized.
- Why it matters:
- Helps infer possible biological roles of new or poorly studied complexes.
- Aids in hypothesis generation by linking detected complexes to known cellular functions.
- Provides visual summaries of functional characteristics, making it easier to interpret results.
Note: If you upload your own PPI network, enrichment analysis requires a corresponding Gene Ontology Annotation File (GAF) to retrieve functional information for the proteins in the network.
14. Can I download the results?
Yes, results can be downloaded as CSV files, enrichment analysis reports as PDFs, and visualizations as high-resolution images.
15. Who do I contact for support?
For bug reports or feature requests, email alberto.paccanaro@rhul.ac.uk.
16. Common Issues
- Data upload error: Ensure the file is in the correct TXT or CSV format and correctly formatted.
- Slow processing time: Large PPI networks may take longer to process, if a considerable amount of time has passed, please do contact us for support.
- Not seeing enrichment results: If the enrichment plots don't show for a particular complex, and you see a loading screen, it could be that there aren't any enriched terms for that complex. We will add a message indicating this in a soon-to-be released version. If you uploaded your own PPI network, make sure you have provided the corresponding Gene Ontology Annotation File (GAF).
9. Contact & Support
ClusterONE Web is free to use, requires no login, and uses cookies to improve user experience.
For bug reports or feature requests, contact alberto.paccanaro@rhul.ac.uk .
PaccanaroLab